The question
Two things prompted this work: the sharp sell-off in memory and storage stocks from late June 2026, and the concern that US equity capital is concentrated in a handful of mega-cap names. My hypothesis: no single company’s market capitalization can exceed half of US federal debt outstanding (about $19.7 trillion today). With the largest companies now worth $4–5 trillion, I read a concentrated market pressing against a ceiling as a sign that US equities are capped and overvalued. This page tests that thesis with data; it is my hypothesis, not an established fact.
1. The storage and memory sell-off
All six names peaked between June 18 and June 25, 2026, after an extraordinary first-half rally (Business Insider reported SanDisk up 764% in H1, the top performer in the S&P 500). The table measures each stock from its post-June-2025 high to its subsequent low, using adjusted daily closes from Yahoo Finance.
| Company | Peak | Peak to trough | Peak to Oct 23, 2026 |
|---|---|---|---|
| Micron (MU) | Jun 25 | −39.1% | −27.7% |
| Western Digital (WDC) | Jun 18 | −55.5% | −53.9% |
| Seagate (STX) | Jun 22 | −42.3% | −42.3% (new low) |
| SanDisk (SNDK) | Jun 25 | −56.5% | −47.0% |
| Samsung Electronics (005930.KS) | Jun 18 | −42.8% | −40.5% |
| SK Hynix (000660.KS) | Jun 22 | −58.1% | −56.2% |
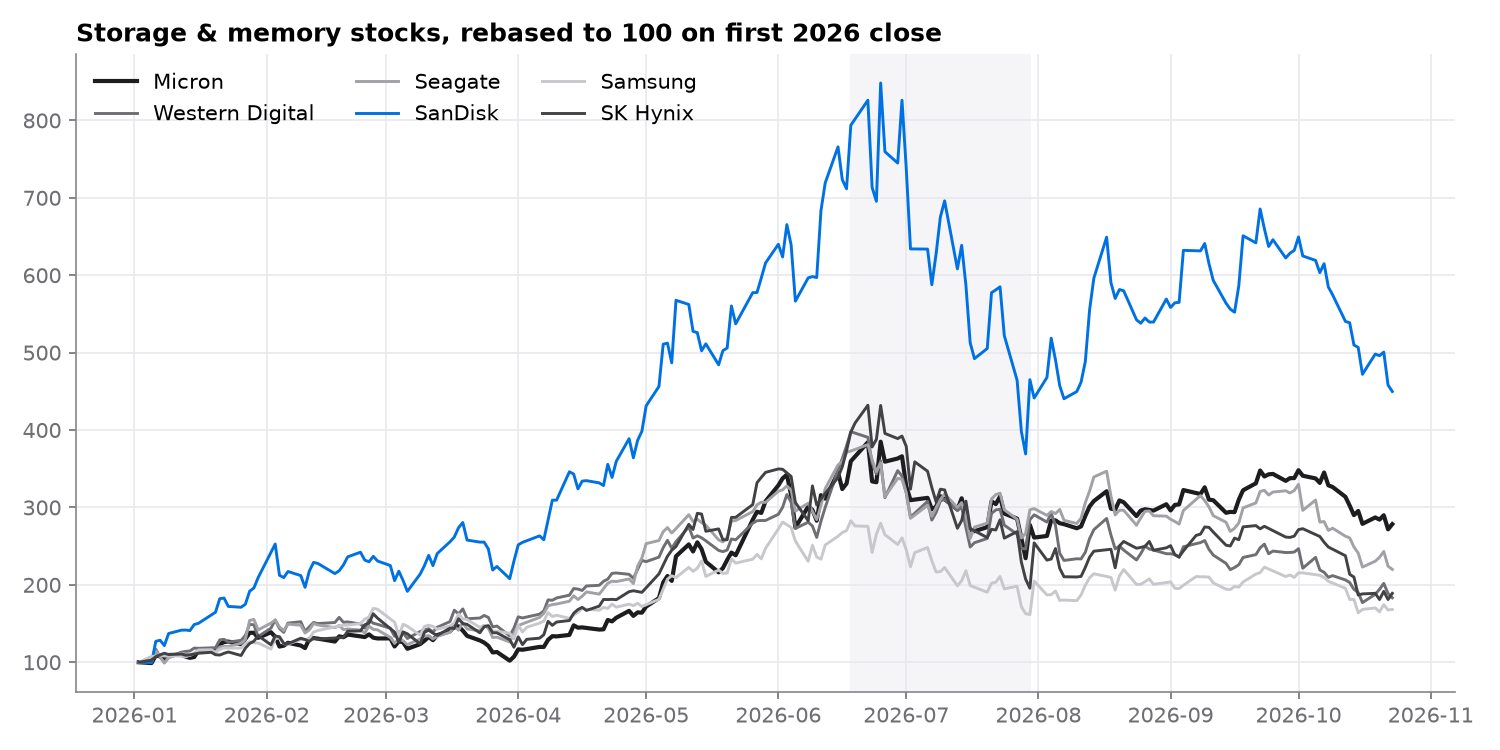
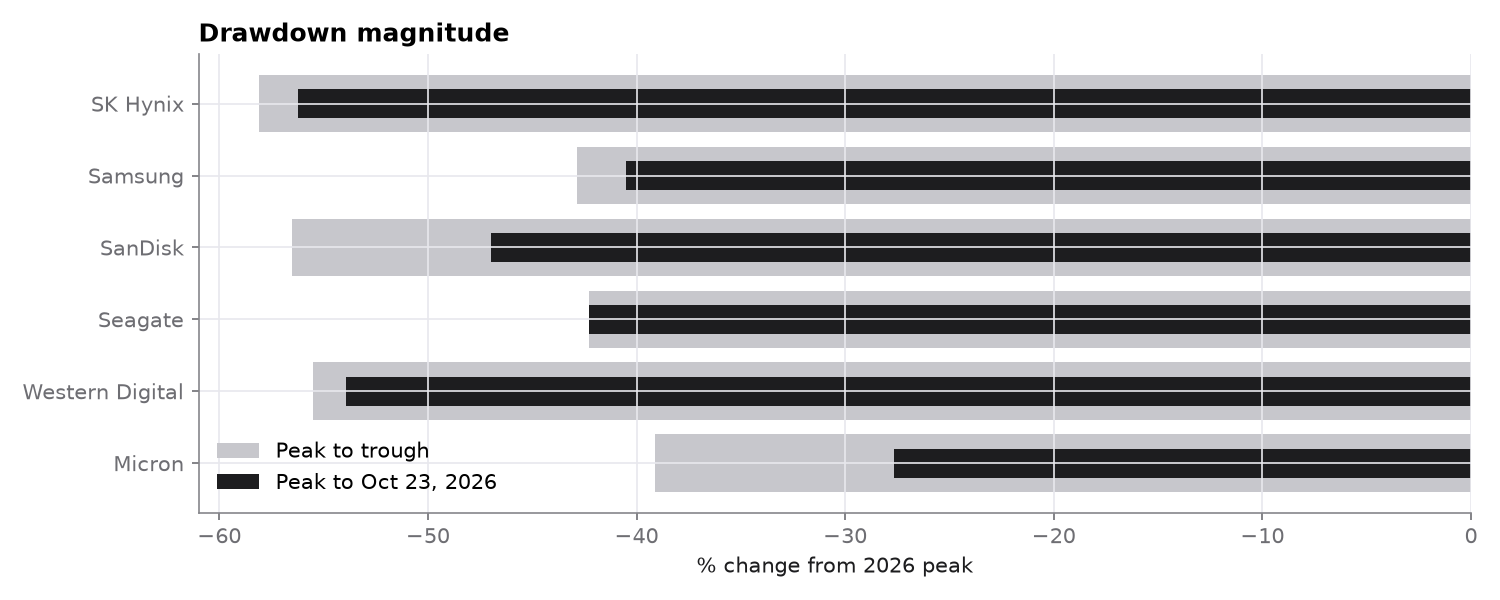
Timeline and drivers, as reported in the news:
- July 13: SK Hynix's Seoul shares fell more than 15%, the biggest one-day drop in nearly two decades, days after a 6B+ US ADR listing. The Kospi fell 9% and triggered a trading halt; Micron fell 6.4%, SanDisk 8.4% and Western Digital 6.8% (Reuters). Analysts cited supply worries from large new Korean fab investments.
- Mid to late July: a rotation out of AI leaders into energy, staples and real estate, with oil rising on renewed US–Iran tension and reviving inflation and rate concerns (Morningstar; CNBC).
- Late July: SK Hynix reported a record Q2 operating profit (+557% YoY) that still missed expectations, and raised 2026 capex by about 50% to at least 1B, feeding over-investment fears; a hawkish Fed hold added pressure (Yahoo Finance).
My read: this was primarily a valuation and positioning reset after a parabolic run, layered with cyclical supply fears. Management teams still guided to demand exceeding supply, so the sell-off is evidence of fragile sentiment, not yet of collapsing fundamentals.
2. How concentrated is the US market?
Using SPY's current top holdings as a proxy for S&P 500 weights: the Magnificent 7 (NVIDIA 8.4%, Apple 7.4%, Microsoft 5.8%, Amazon 3.7%, Alphabet A+C 5.5%, Meta 2.4%, Tesla 1.5%) account for about 34.6% of the index, and the ten largest holdings listed (which include Broadcom and Micron) about 39.0%. NVIDIA and Apple each carry a market cap of roughly .1 trillion.
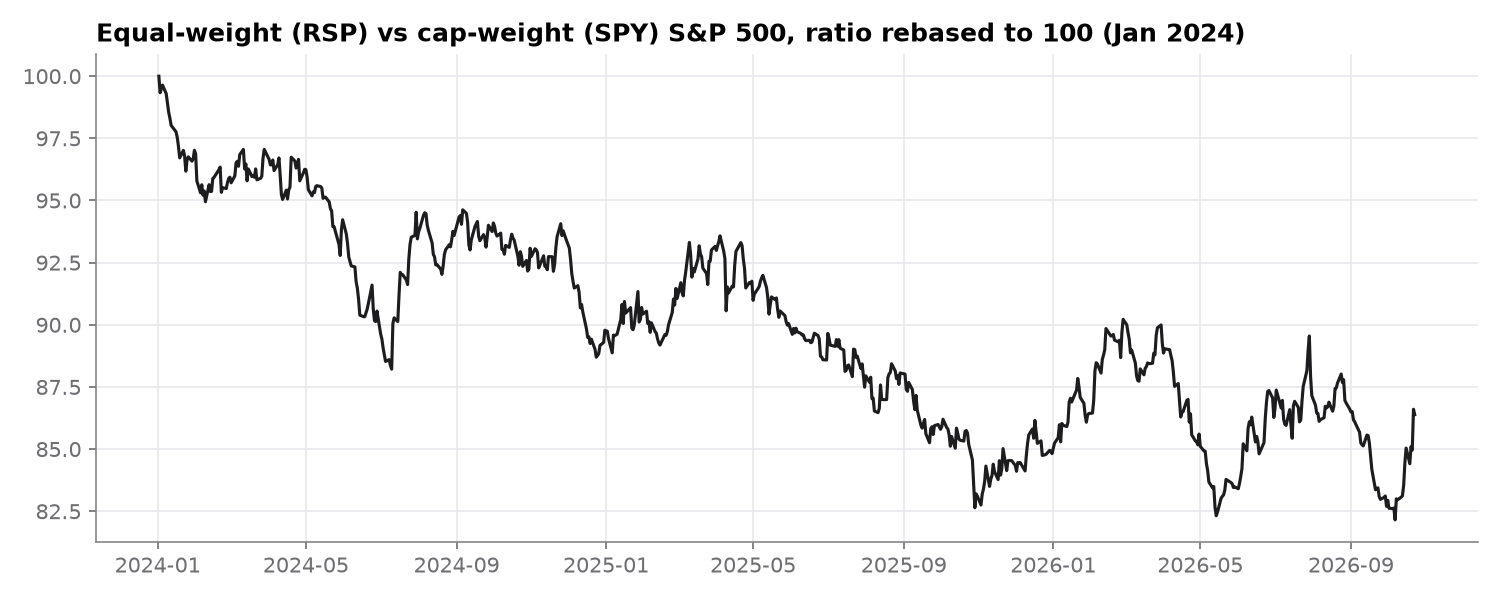
This supports the concentration part of the thesis: index returns depend heavily on a few AI-linked companies, the same complex that just sold off sharply in memory.
3. Valuation versus Treasuries
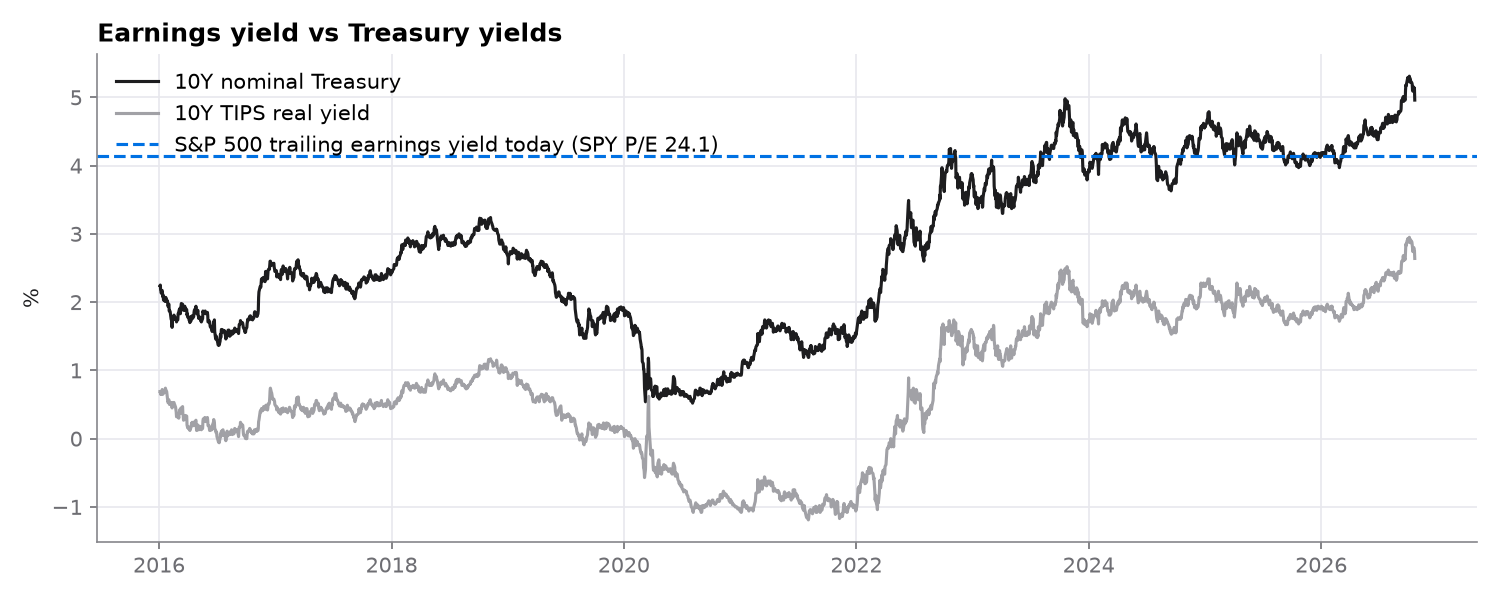
Earnings yield vs. the 10-year. SPY's trailing P/E is 24.1 (Yahoo Finance), an earnings yield of about 4.1%. The 10-year Treasury yielded 4.96% on October 22, 2026, and the 10-year TIPS real yield 2.64% (FRED). The simple "Fed model" spread is about −0.8 percentage points: investors earn less earnings yield on stocks than the nominal yield on risk-free bonds. Against the real yield the gap is about +1.5 points, thin by historical standards.
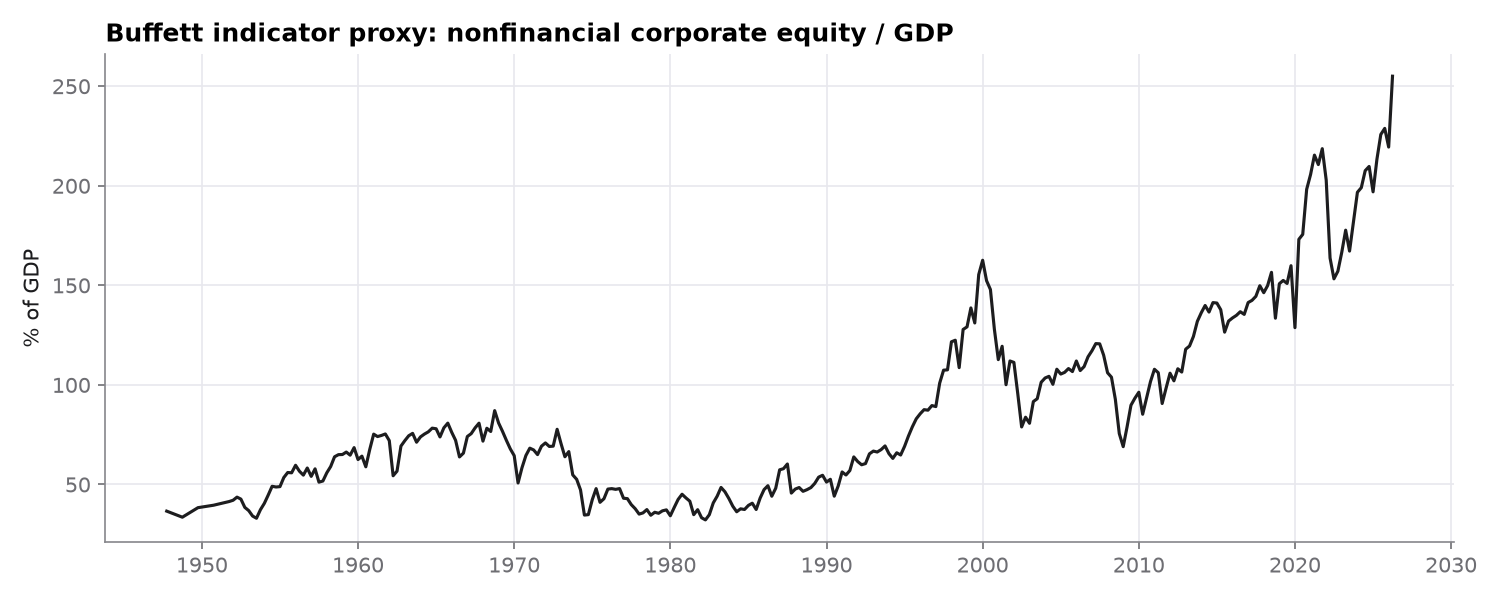
Buffett indicator. The market value of nonfinancial corporate equities (Fed Z.1, FRED series NCBEILQ027S) was about 3.1 trillion in Q2 2026, roughly 255% of GDP, the highest reading in the series.
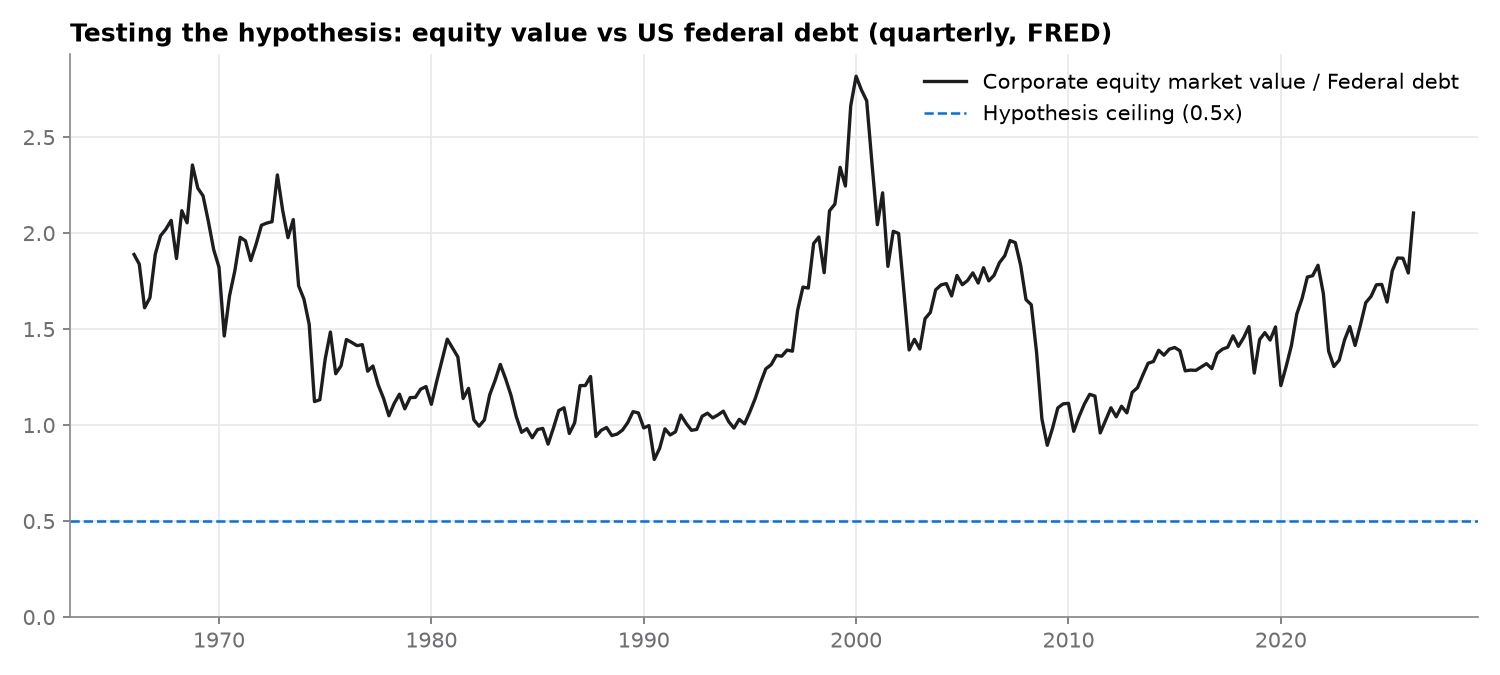
Context: the whole market vs. debt. In aggregate, US nonfinancial corporate equity is worth about 2.1× federal debt ($83.1T vs. $39.5T, Q2 2026), in the upper part of its 0.82×–2.82× range since 1966. This is supporting context for the valuation picture, not the test itself.
4. Testing the hypothesis: single companies vs. federal debt
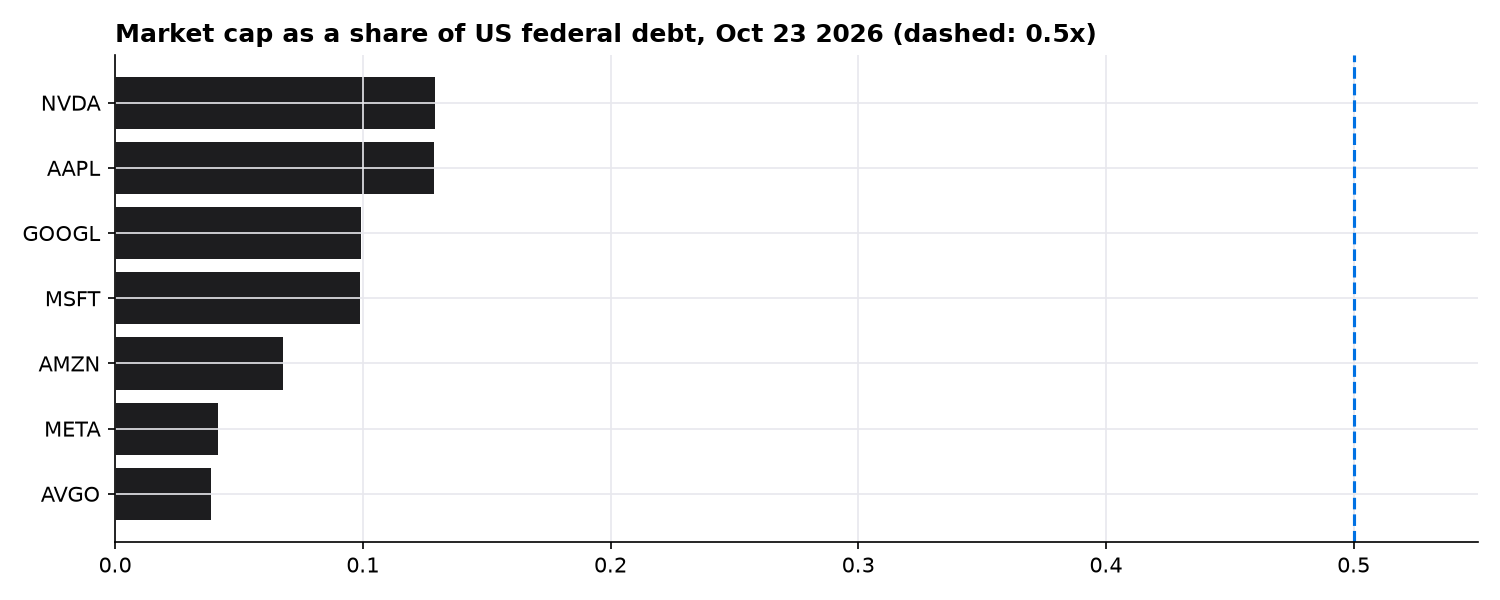
Federal debt outstanding (FRED GFDEBTN, Q2 2026) is $39.46 trillion, so the hypothesized ceiling is $19.7 trillion for any one company. Market caps on October 23, 2026 (Yahoo Finance):
| Company | Market cap | × federal debt | Rise needed to reach 0.5× |
|---|---|---|---|
| NVIDIA | $5.09T | 0.129× | +287% |
| Apple | $5.07T | 0.129× | +289% |
| Alphabet | $3.92T | 0.099× | +404% |
| Microsoft | $3.89T | 0.099× | +407% |
| Amazon | $2.68T | 0.068× | +538% |
| Meta | $1.64T | 0.041× | +1,005% |
| Broadcom | $1.54T | 0.039× | +1,085% |
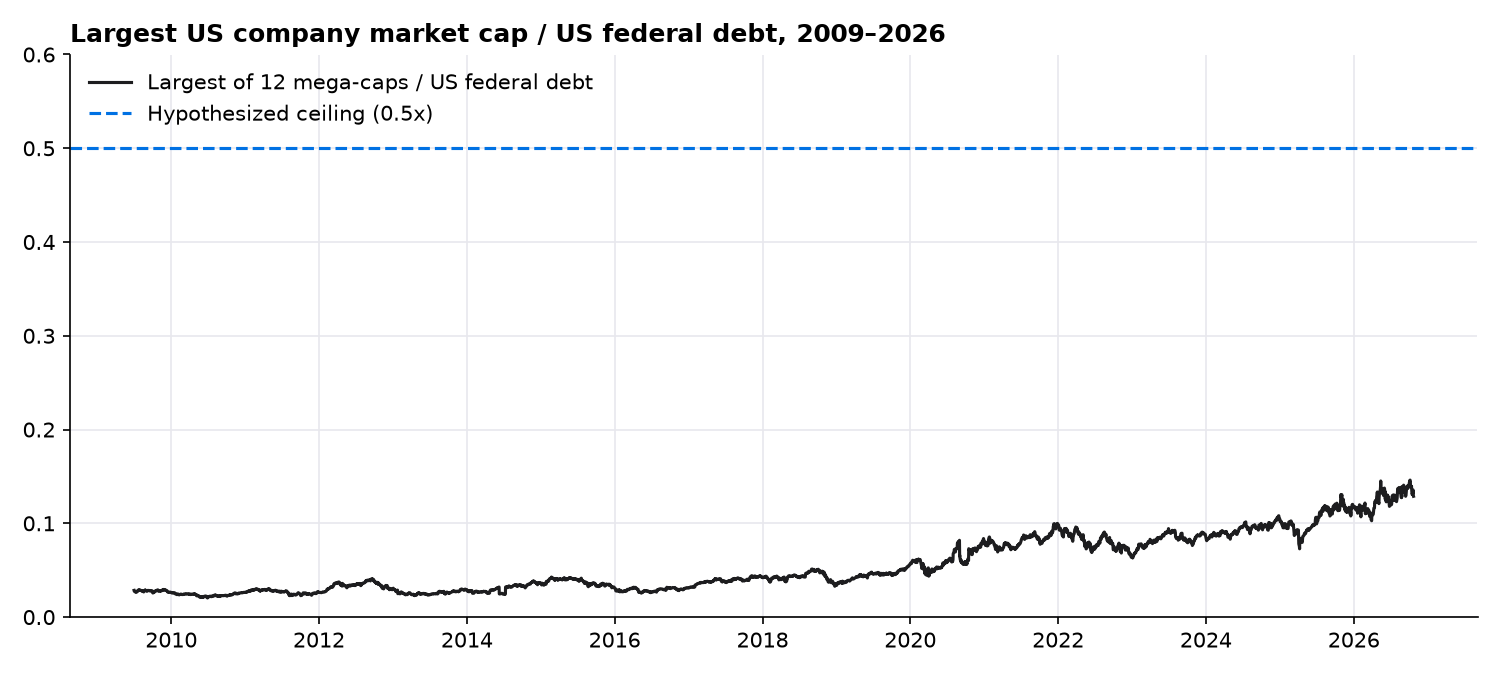
History. I rebuilt daily market caps for 12 mega-caps (Apple, Microsoft, NVIDIA, Alphabet, Amazon, Meta, Broadcom, Exxon Mobil, GE, Walmart, Cisco, Intel) from split-adjusted prices and shares outstanding reported in SEC filings (XBRL), then divided the largest by federal debt. The largest company has ranged from 0.020× (June 2010, Exxon Mobil) to a peak of 0.146× (October 6, 2026, NVIDIA), and stands at 0.129× today.
Verdict
I found no historical or theoretical basis for a 0.5× ceiling. No company in this sample has come close: the record is about 0.15×, and the largest company today would have to almost quadruple to reach the line. Market value is driven by expected cash flows and discount rates, while federal debt reflects fiscal policy; no accounting identity ties them, and because debt keeps growing, the “ceiling” itself rises every year. The data do not support the hypothesis as a binding limit, and even if it held, it would imply large upside before any cap, not a cap today. The stronger version of the bearish case rests on concentration and valuation (sections 2 and 3), not on this ratio, and on whether mega-cap growth can keep outpacing debt and money supply (section 5).
5. Debt, liquidity, and a moving ceiling
Any ceiling defined against federal debt moves as the debt grows, so the relevant question is relative growth. From Q3 2009 to Q2 2026, federal debt grew from $11.9T to $39.5T (7.4% a year) and M2 money supply from $8.5T to $23.1T (6.2% a year, FRED M2SL). Over the same period the largest company in my sample grew from about $0.33T to $4.84T (17.5% a year) and the S&P 500 price index 12.4% a year. Since Q4 2019 the gap widened: debt 8.5%, M2 6.5%, largest company 22.4% a year.
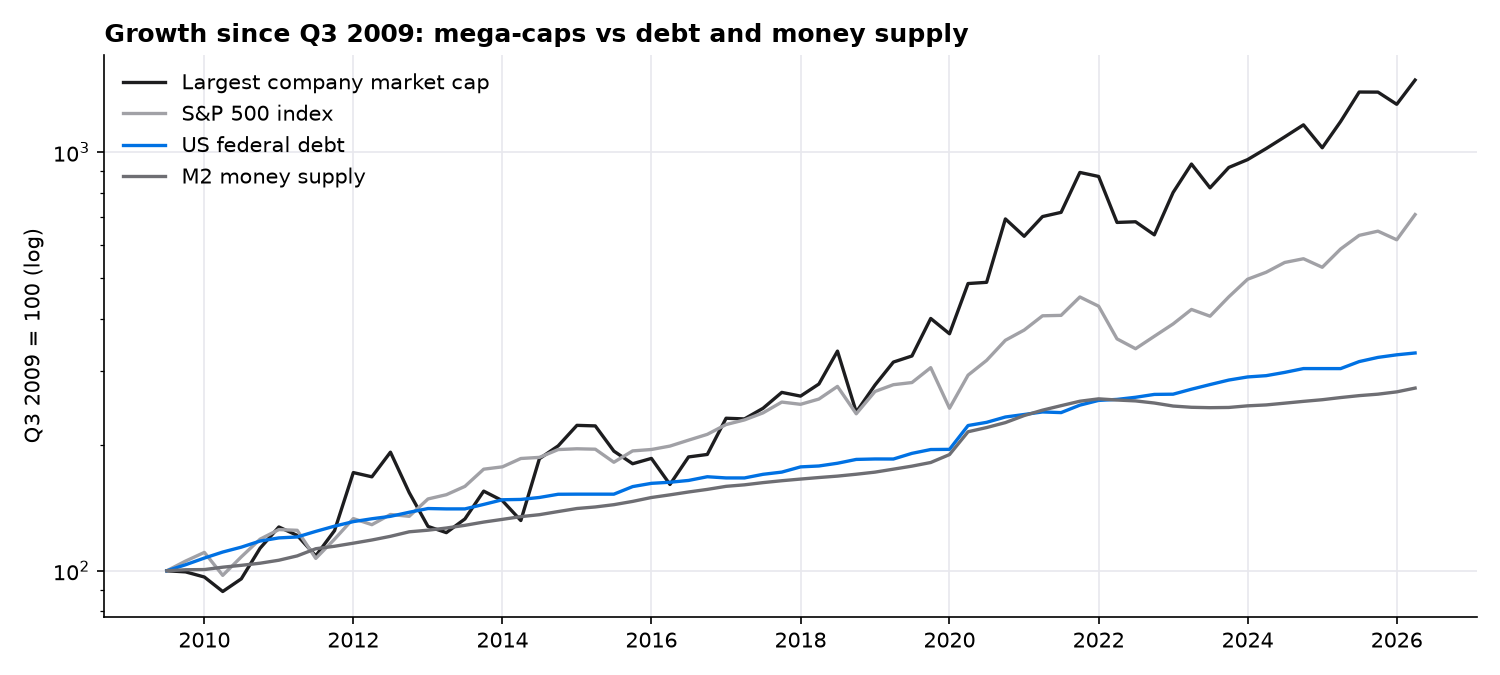
Two readings follow. First, the steadily rising debt stock has not, so far, crowded out equity: mega-cap value has compounded more than twice as fast as both debt and money supply, which is why the single-company ratio has climbed from 0.02× to 0.13×. Second, that pace cannot continue indefinitely relative to the economy. As pure arithmetic, not a forecast, if the 2009–2026 growth gap persisted, the largest company would reach 0.5× of debt in roughly 15 years. The more practical constraint is the one in section 3: with Treasury yields above the market's earnings yield, bonds now compete directly for the same capital, and mega-cap growth that outruns debt and liquidity by this margin depends on earnings keeping up.
Conclusion
The bearish instinct has real support: concentration is high, the equity risk premium against Treasuries is near zero or negative, and the Buffett indicator is at a record. The memory sell-off showed how quickly the AI leadership trade can reverse. My single-company ceiling, however, is not supported: the largest US company is worth about 0.13× federal debt, the highest in my sample is about 0.15×, and nothing in finance theory ties a company’s value to the size of government debt. The data do not show mega-caps sitting near a cap. The balanced view is that concentration and thin equity risk premia argue for caution and diversification, while the 0.5× rule should not be used as a valuation anchor or a timing signal.
Methodology
- Daily adjusted closes for MU, WDC, STX, SNDK, 005930.KS, 000660.KS, SPY and RSP from Yahoo Finance (yfinance), January 2024 to October 23, 2026.
- Drawdowns measured from the highest close since June 1, 2025 to the lowest close thereafter.
- Index weights from SPY's top-holdings disclosure via yfinance; Mag 7 includes both Alphabet share classes.
- Quarterly equity market value (NCBEILQ027S), federal debt (GFDEBTN) and GDP from FRED; daily yields DGS10 and DFII10.
- Single-company market caps: split-adjusted close × reported shares outstanding (SEC XBRL, forward-filled between filings), divided by GFDEBTN.
- Growth rates: compound annual rates between quarter-end values, Q3 2009 to Q2 2026; M2 from FRED M2SL.
- Charts built in Python with pandas and matplotlib. Raw CSVs are in
/data.
Data sources
- FRED NCBEILQ027S · GFDEBTN · GDP · DGS10 · DFII10 · M2SL
- SEC EDGAR XBRL API
- Yahoo Finance via yfinance
- News: Reuters, Morningstar, CNBC, Yahoo Finance and Business Insider, linked above.
Limitations
- NCBEILQ027S covers nonfinancial corporate equity only. It is a proxy for total US market cap, not the S&P 500 or Wilshire 5000.
- Federal debt (GFDEBTN) includes intragovernmental holdings; debt held by the public is smaller, which would push the ratio even higher.
- Index weights come from SPY's top holdings on one date, not an official S&P history, so I could not chart top-10 concentration over time.
- Trailing P/E is from a single data vendor, and the earnings-yield comparison ignores growth expectations.
- Single-company history starts in mid-2009, when SEC XBRL share data begins; earlier decades (for example the 2000 Microsoft and GE peaks) are not covered. The 12-company sample may miss the true largest firm in some periods.
- Alphabet and Meta share counts were not available in the same SEC field, so their history assumes today’s share count; buybacks make this a rough estimate.
- Korean prices are in KRW and US prices in USD; the analysis uses percentage changes only.